Business intelligence in retail uses technology to gather, analyze, and present business data, empowering leaders to make smarter, more profitable decisions. It translates raw numbers from sales, inventory, and customer interactions into clear, actionable insights, acting as the central nervous system for your entire retail operation.
Why Business Intelligence is Your New Retail Blueprint

Running a modern retail business without a data strategy is like navigating an ocean without a map. You might stay afloat, but you lack direction and a reliable path to your destination. Business intelligence (BI) is that map, providing the strategic guidance needed to thrive in a competitive market.
BI platforms consolidate data from your point-of-sale (POS) systems, e-commerce site, inventory software, and supply chain logs into a single, unified view. This perspective replaces guesswork with a proactive, data-driven strategy.
From Raw Data to Actionable Strategy
The core purpose of business intelligence in retail is to answer critical operational questions quickly and accurately, turning gut feelings into informed actions.
BI helps you answer questions that drive immediate results:
- Which products drive the most profit? Optimize your product mix and focus marketing spend on top performers.
- Who are my best customers and what do they buy? Fuel personalized marketing and loyalty programs that increase customer lifetime value.
- How do I balance stock levels for seasonal demand? Use accurate demand forecasting to prevent stockouts during peak seasons and avoid overstock in the off-season.
This shift explains the massive industry investment. The global market for business intelligence software was valued at USD 41.74 billion in 2024 and is projected to reach USD 151.26 billion by 2034. This growth shows how retailers are using data to sharpen every business function. You can explore the full business intelligence market report on precedenceresearch.com.
At its heart, business intelligence converts complex data into a simple story. It tells you what's working, what isn't, and where your greatest opportunities lie.
Ultimately, implementing BI is about building a culture of informed decision-making. Providing teams with easy-to-use dashboards and trustworthy reports empowers them to make smarter choices that directly boost the bottom line, leading to greater efficiency and a sustainable competitive edge.
Solving Real Retail Challenges with BI

The true value of business intelligence is its ability to solve the day-to-day problems that erode profits, such as disorganized inventory and ineffective marketing. It's about using data to take decisive action.
This is why the retail analytics market, a key component of BI, was valued at USD 8.66 billion in 2024 and is expected to hit USD 10.77 billion by 2025. You can dig into the specifics in the retail analytics global market report on thebusinessresearchcompany.com. This growth is driven by tangible results.
The following table highlights how BI addresses common retail challenges with specific applications and measurable outcomes.
Key Retail BI Use Cases and Their Business Impact
Retail ChallengeBI ApplicationMeasurable Business OutcomeInventory Imbalance: Overstocked on slow-movers, sold out of bestsellers.Predictive Demand Forecasting: Analyzes sales velocity, seasonality, and promotions to automate reordering.Reduced holding costs by 10-15%; minimized stockouts, leading to higher customer satisfaction.Generic Marketing: Low engagement and wasted ad spend on one-size-fits-all campaigns.Customer Segmentation: Unifies purchase history and browsing data to create detailed customer profiles for targeted offers.Increased campaign ROI by 20%+; improved customer loyalty and lifetime value.Hidden Profit Drains: Unclear which products, stores, or promotions are truly profitable.Profitability Analysis: Drills down into sales vs. cost of goods, marketing, and operational expenses per SKU/store.Improved overall margins by identifying and focusing on high-profit items and locations.Inefficient Store Layout: Poor customer flow, missed cross-sell opportunities.In-Store Analytics: Uses heat maps and basket analysis to understand shopper movement and product affinities.Increased average transaction value by optimizing product placement and adjacencies.
This table shows how BI directly connects data to profitable action. Each application provides the clarity needed to make smarter, faster decisions that positively impact the bottom line.
Use Case: Optimizing Inventory and Supply Chains
The classic retail challenge is having too much of what people don't want and not enough of what they do. BI tools address this by connecting sales data, supply chain information, and external factors like weather to build predictive models.
Outcome: These systems forecast actual demand, enabling automated reordering that keeps stock at optimal levels. A BI dashboard can flag slow-moving products for clearance or alert you to a demand spike, allowing you to reorder before shelves go empty. This cuts holding costs and prevents lost sales from stockouts.
Use Case: Personalizing Customer Marketing
Generic marketing campaigns are inefficient. Today's shoppers expect personalized offers that reflect their habits. BI platforms make this possible by unifying data from loyalty programs, browsing history, and in-store purchases.
Outcome: This detailed customer view allows for sharp, targeted marketing. A grocer can identify organic produce buyers and send them a special offer on a new line of organic snacks. This relevance builds loyalty and can help recover 15% of abandoned carts through timely, personalized follow-ups.
Use Case: Pinpointing Sales and Profitability Trends
It's often difficult to know which products are truly profitable. A high-volume seller might have razor-thin margins, while a slower-moving item could be a hidden profit driver.
Outcome: BI dashboards integrate sales data with cost of goods and operational expenses to reveal true profitability. A manager can analyze performance from a national level down to a single item in a specific store. This insight allows them to double down on high-margin products or replace underperformers, directly boosting the bottom line. For a deeper dive, enhance logistics with Python data analytics to gain a major competitive edge.
Use Case: Enhancing Store Operations and Layout
A poorly designed store layout can kill sales. BI replaces guesswork with data by analyzing information from in-store sensors and sales transactions to generate store heat maps.
Outcome: You can see which aisles are busiest and where shoppers linger, enabling data-driven optimization. For example, a grocery store might use basket data to place salsa next to tortilla chips, creating an effortless cross-sell that increases the average basket size. It’s a simple change backed by real customer behavior.
Tracking the Metrics That Actually Matter
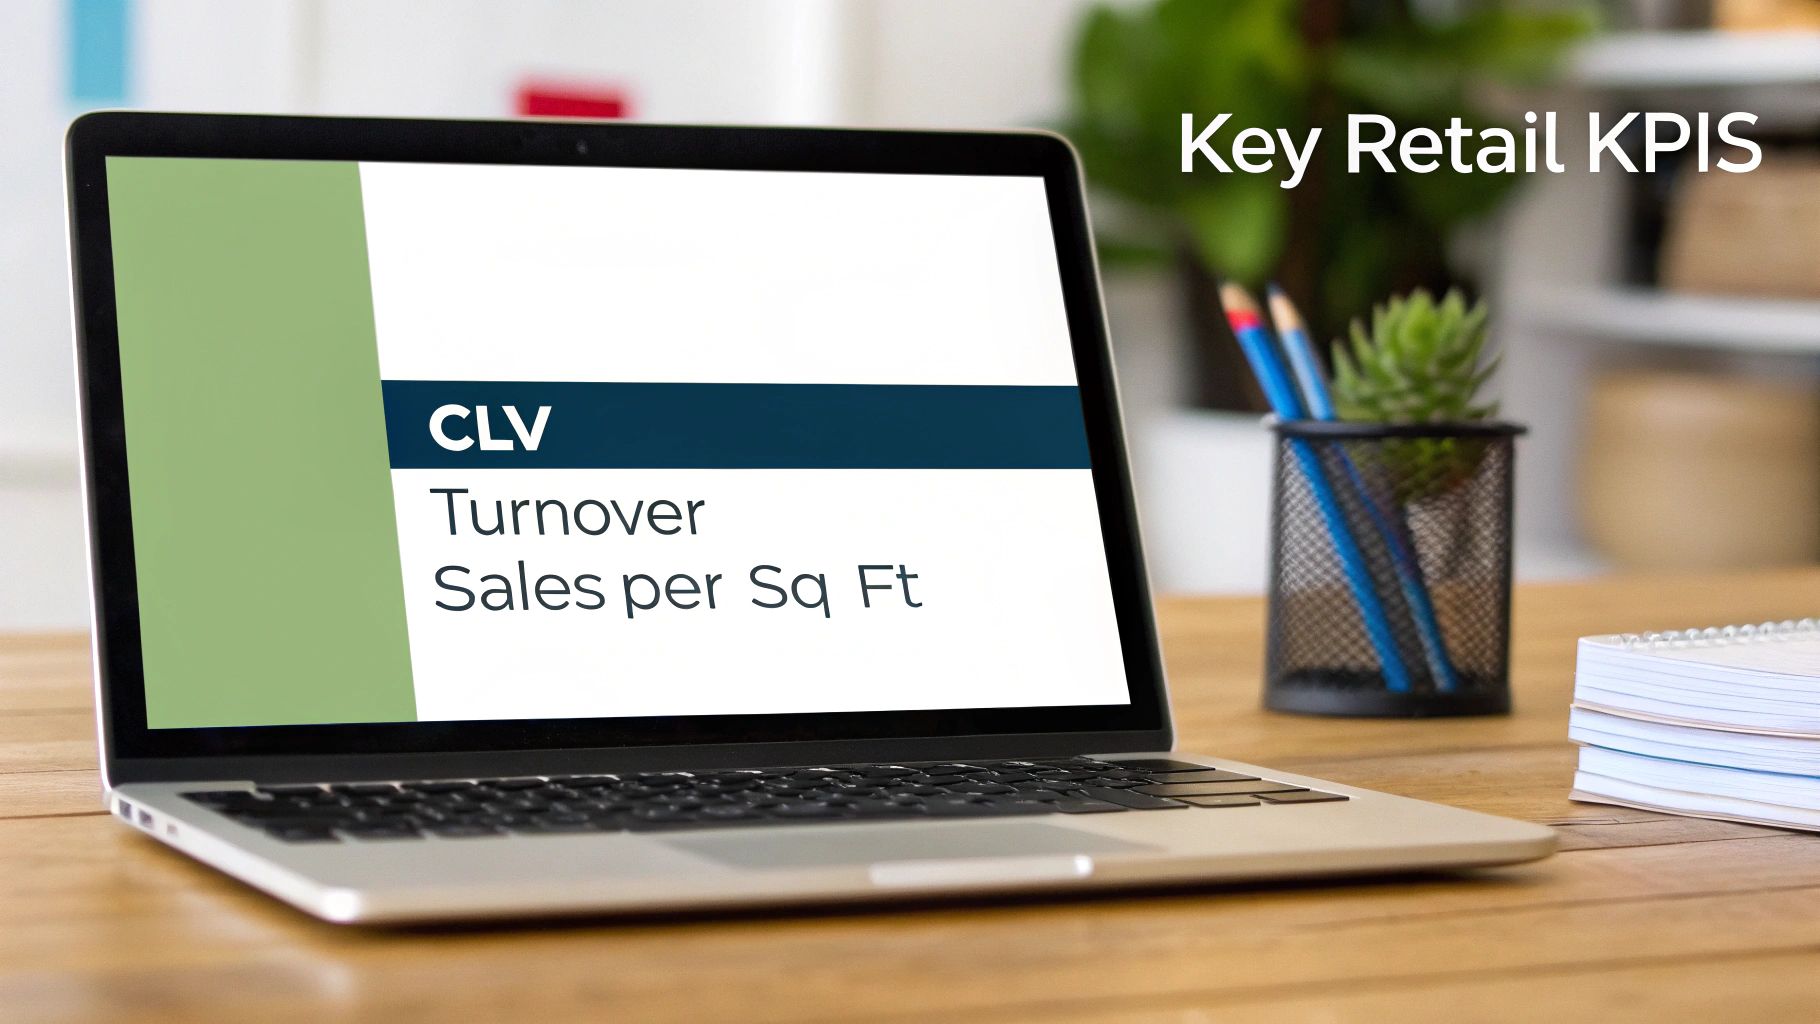
The power of business intelligence in retail comes from tracking the right Key Performance Indicators (KPIs) that reflect business health. Focusing on impactful KPIs turns a noisy dashboard into a decisive tool. Grouping metrics by category provides a complete view, from high-level sales to operational efficiency.
Sales Performance KPIs
These metrics provide a direct pulse on revenue and profitability.
- Average Transaction Value (ATV): The average amount a customer spends per transaction. A rising ATV indicates successful upselling and cross-selling strategies.
- Sales per Square Foot: The revenue generated per square foot of sales floor. This helps optimize store layouts for maximum profit.
- Conversion Rate: The percentage of visitors who make a purchase. A low rate can signal issues with product placement, pricing, or customer experience.
Monitoring these KPIs helps you quickly identify what's working. For instance, a high conversion rate but low ATV might signal a need for better cross-selling training.
Customer-Centric KPIs
These KPIs measure loyalty, satisfaction, and the long-term value of each customer.
Successful retailers use business intelligence not just to sell products, but to build lasting relationships.
- Customer Lifetime Value (CLV): The total profit expected from a single customer over their entire relationship with your brand. A high CLV indicates strong loyalty.
- Customer Retention Rate: The percentage of customers who return for another purchase. Retaining customers is more cost-effective than acquiring new ones.
- Purchase Frequency: How often the average customer buys from you. Increasing this number directly boosts revenue.
Analyzing these metrics helps you identify your most valuable customers, enabling you to create targeted loyalty programs that keep them coming back.
Inventory and Operations KPIs
These KPIs focus on stock management and operational efficiency, which directly impact cash flow and margins.
- Inventory Turnover: How many times your inventory is sold and replaced over a period. A high rate indicates strong sales and efficient buying.
- Gross Margin Return on Investment (GMROI): The gross profit earned for every dollar invested in inventory. This helps identify your most profitable products.
- Sell-Through Rate: The percentage of inventory sold versus the amount received from a supplier. This is crucial for evaluating product and promotion performance.
By tracking these KPIs, you can make smarter purchasing decisions, reduce carrying costs, and improve overall operational efficiency.
Building Your Modern Retail Data Engine

To achieve real-time insights, you need a modern data architecture where information flows seamlessly from its source to decision-makers. This "data engine" acts as the central nervous system for your retail operation. At its heart is a cloud data platform that centralizes and prepares all business information for analysis.
The Four Pillars of a Modern Data Architecture
A solid retail BI architecture consists of four key stages that work together to turn raw numbers into strategic action.
- Data Sources (The Raw Ingredients): Data flows in from every touchpoint, including point-of-sale (POS) terminals, e-commerce platforms, and inventory management software.
- Data Ingestion (The Delivery Trucks): Automated pipelines reliably transport data from all sources into your central system.
- Storage and Processing (The Central Warehouse): A scalable cloud data warehouse like Snowflake stores massive amounts of data and has the power to run complex queries in seconds.
- Visualization and Analytics (The Storefront): BI tools like Tableau or Power BI connect to the warehouse, turning complex data into intuitive dashboards for users.
This integrated environment moves you beyond slow, siloed spreadsheets. For businesses with huge datasets, understanding how to handle time series data with Snowflake is a crucial advantage.
The Rise of Agentic AI in Retail BI
The next evolution is incorporating AI to make your data engine proactive. AI agents can work in the background to automatically find and flag important insights, shifting your team from pulling information to having it pushed to them when it matters most.
An AI agent is a smart assistant layered over your data that understands natural language, runs its own analysis, and presents findings in a simple format.
Making Your Data Work for You
When AI agents are integrated into your BI workflow, your data engine becomes an active partner in running the business.
Here’s what that looks like in practice:
- Automated Queries: A store manager can ask, "Which products are seeing an unusual sales spike this week?" The AI agent queries the data and provides a direct answer.
- Narrative Summaries: Instead of just a chart, the agent explains what the data means, such as, "Sales of umbrellas are up 300% this week, likely due to the unexpected rain forecast."
- Proactive Alerts: The system monitors key metrics and can automatically alert a manager if inventory for a bestseller drops, preventing a stockout before it happens.
This modern data engine transforms business intelligence in retail from a reactive reporting tool into a proactive, strategic powerhouse.
Your Step-by-Step Retail BI Implementation Plan
Implementing business intelligence can be a manageable process if approached in phased stages. This methodical approach builds momentum and demonstrates value early on. Think of it as building a house: you start with a solid blueprint and a strong foundation.
Phase 1: Strategy and Goal Setting
Before selecting any software, define what success looks like by tying your BI initiative to specific business objectives. Start by identifying your biggest challenges. Are you struggling with stockouts? Are marketing campaigns underperforming?
Once you've identified a core challenge, define the KPIs to measure progress. For example, if inventory is the problem, your goals might be:
- Cut inventory holding costs by 10% in six months.
- Boost inventory turnover for top categories by 15%.
- Reduce stockout incidents by 25% during peak seasons.
Clear, measurable targets guide the entire project and ensure every decision is tied to a business outcome.
Phase 2: Building the Data Foundation
With clear goals, you can build the technical foundation. This phase involves choosing the right tools and ensuring your data is clean, accurate, and trustworthy.
First, map your primary data sources, such as your Point-of-Sale (POS) system, e-commerce platform, and CRM. The goal is to consolidate this information into a single source of truth.
Next, select your technology stack, which often includes:
- A cloud data warehouse like Snowflake or Google BigQuery for scalable storage and processing.
- An ETL/ELT tool to automate data loading into the warehouse.
- A BI and visualization tool like Tableau or Microsoft Power BI to create user-friendly dashboards.
Data quality is the most critical part of this phase. Invest in processes to clean, standardize, and govern your data to ensure reliable insights.
Phase 3: Development and Pilot Programs
Now, start building and testing your solution on a small scale. A pilot program allows you to work out kinks, gather feedback, and demonstrate quick wins with lower risk.
Develop your first dashboards focused on the high-impact KPIs defined in Phase 1. For example, create an inventory dashboard for category managers to track sell-through rates and stock levels in near real-time.
Train the pilot group to use the new tools effectively. Empower them to ask questions and understand the data, showing them how BI can make their decisions smarter and their jobs easier.
Phase 4: Scaling and Optimization
After a successful pilot, scale the solution across the organization and continuously improve it. The initial dashboards are just the beginning.
Collect feedback from your initial users to refine existing dashboards and guide future development. As more teams gain access, expand the BI system's scope to other areas like marketing analysis and store operations.
This final stage is an ongoing cycle of building, listening, and refining. By fostering a data-driven culture, you create a BI system that grows with your business and provides a lasting competitive edge.
How Top Retailers Win with Data
The true power of business intelligence in retail is seeing how data becomes a competitive advantage. Top brands use it to make smarter, faster decisions that drive growth.
Use Case: Keeping Pace with Fast Fashion Trends
An apparel brand struggled to keep up with viral social media trends. By implementing a BI system to monitor social media mentions and search trends in real time, they could spot emerging styles early.
Outcome: They connected this external data with their internal sales and inventory systems, allowing them to pivot marketing and shift stock to meet sudden demand. This resulted in fewer missed sales and a stronger connection with their customers.
Use Case: Turning Shopper Habits into Higher Sales
A leading grocery chain wanted to increase its average sale per customer. They used BI to conduct a deep "market basket analysis" on millions of transactions to identify which products were frequently bought together.
By understanding not just what customers buy, but how they buy, retailers can engineer a more intuitive and profitable shopping experience.
Outcome: The analysis revealed a strong link between premium cheeses and a specific brand of crackers. They redesigned store layouts to place these items together and created bundled deals. This single data-driven change led directly to larger basket sizes and increased store revenue.
Capitalizing on Consumer Conversations
These examples highlight the rise of social business intelligence. This market was valued at USD 29.3 billion in 2024 and is expected to reach USD 81.05 billion by 2033, with retail leading the way. This growth is driven by the need to analyze online conversations for valuable feedback. You can explore the full social business intelligence market report on grandviewresearch.com.
Each of these cases confirms that winning retailers use data to answer specific questions and achieve measurable results.
Common Questions About BI in Retail
Retailers often have practical questions about the cost, scope, and implementation of business intelligence. The good news is that modern tools have made data-driven insights more accessible than ever.
How Can a Small Retail Business Start with BI on a Limited Budget?
Start with a single, high-impact business question, such as identifying your top 10 best-selling products. You can likely use the built-in analytics of your existing POS or e-commerce platform. For the next step, cloud-based BI tools like Power BI or Tableau offer free or low-cost plans that can connect to a simple data source like an Excel spreadsheet.
The key is to start small. Pick one project that delivers a clear win, prove its value, and then build from there. This approach creates momentum without straining your budget.
What Is the Difference Between Retail Analytics and Business Intelligence?
Think of it this way: Business Intelligence (BI) is about the what. It organizes historical data into dashboards to show you what happened.
Retail Analytics, a subset of BI, tells you why it happened and what might happen next. It is more forward-looking, applying statistical models to your data to identify patterns and make forecasts.
How Long Does It Take to Implement a BI Solution?
The timeline depends entirely on the project's scope. A simple project, like building basic sales dashboards from a single data source, can be completed in a few weeks. A comprehensive overhaul connecting multiple systems like your ERP, CRM, and e-commerce platforms could take six to twelve months.
A phased rollout is almost always the smartest strategy, allowing you to deliver value in manageable chunks rather than attempting everything at once.


