
Buildings account for approximately 30% of global final energy use and more than 55% of worldwide electricity consumption, according to the International Energy Agency's analysis of buildings. That makes energy management systems more than a facilities dashboard. They're an operating discipline for controlling a major, measurable cost base across plants, campuses, infrastructure, and distributed portfolios.
The practical distinction matters. A dashboard can show yesterday's load. An EMS should help a team decide what changed, why it changed, who owns the response, and whether the corrective action improved performance. In enterprise environments, that requires a governed data backbone, a closed-loop Plan-Do-Check-Act process, and controls that remain useful after the implementation team has left.
Why Energy Management Systems Matter Now
Energy has moved from a facilities cost line to an executive operating concern because consumption affects production cost, building performance, resilience, emissions, and capital planning at the same time. The buildings sector's demand has increased at an average annual rate of about 1.1% since 2000, while structured energy management gives organizations a way to manage performance rather than react to utility bills. The IEA's buildings report provides the wider context for that shift.
ISO 50001 helped formalize the management-system approach. Published in June 2011 after development involving more than 50 countries, it established a broadly applicable framework for measuring energy use, setting objectives, implementing improvements, and reviewing results. Certificates rose from 459 in 2011 to 20,216 by the end of 2016, including a 69% increase in a single year between 2015 and 2016, as documented by ISO's overview of the standard's development and adoption.

From monitoring to management
Ad-hoc monitoring answers, “How much energy did we use?” An EMS adds the questions that make the number actionable:
- What changed? Compare actual consumption with an expected baseline.
- Why did it change? Join energy data with production, weather, occupancy, schedules, and equipment state.
- Who acts? Assign an owner to the significant energy use or operating deviation.
- Did the action work? Verify normalized performance after the intervention.
That distinction is where the business case becomes credible. ISO reports that organizations adopting the standard commonly achieved energy-cost savings ranging from 5% to 30% during the first five years, with examples including more than USD 3 million in annual savings at Cummins and a 10% energy-consumption reduction plus USD 9 million in cost reduction at LG Chem. These figures appear in ISO's energy-management coverage, and they illustrate why leaders should fund operating processes, not just software licenses.
Practical rule: If a proposed EMS can't connect a meter reading to an owner, an operational context, and a verified action, it's monitoring infrastructure, not a management system.
Enterprise EMS programs also depend on the physical infrastructure that moves data reliably. Teams modernizing facilities, plants, or communications sites may find useful adjacent planning context in this resource on end-to-end telecom construction, especially when energy telemetry must be coordinated with distributed infrastructure work.
What an Energy Management System Actually Is
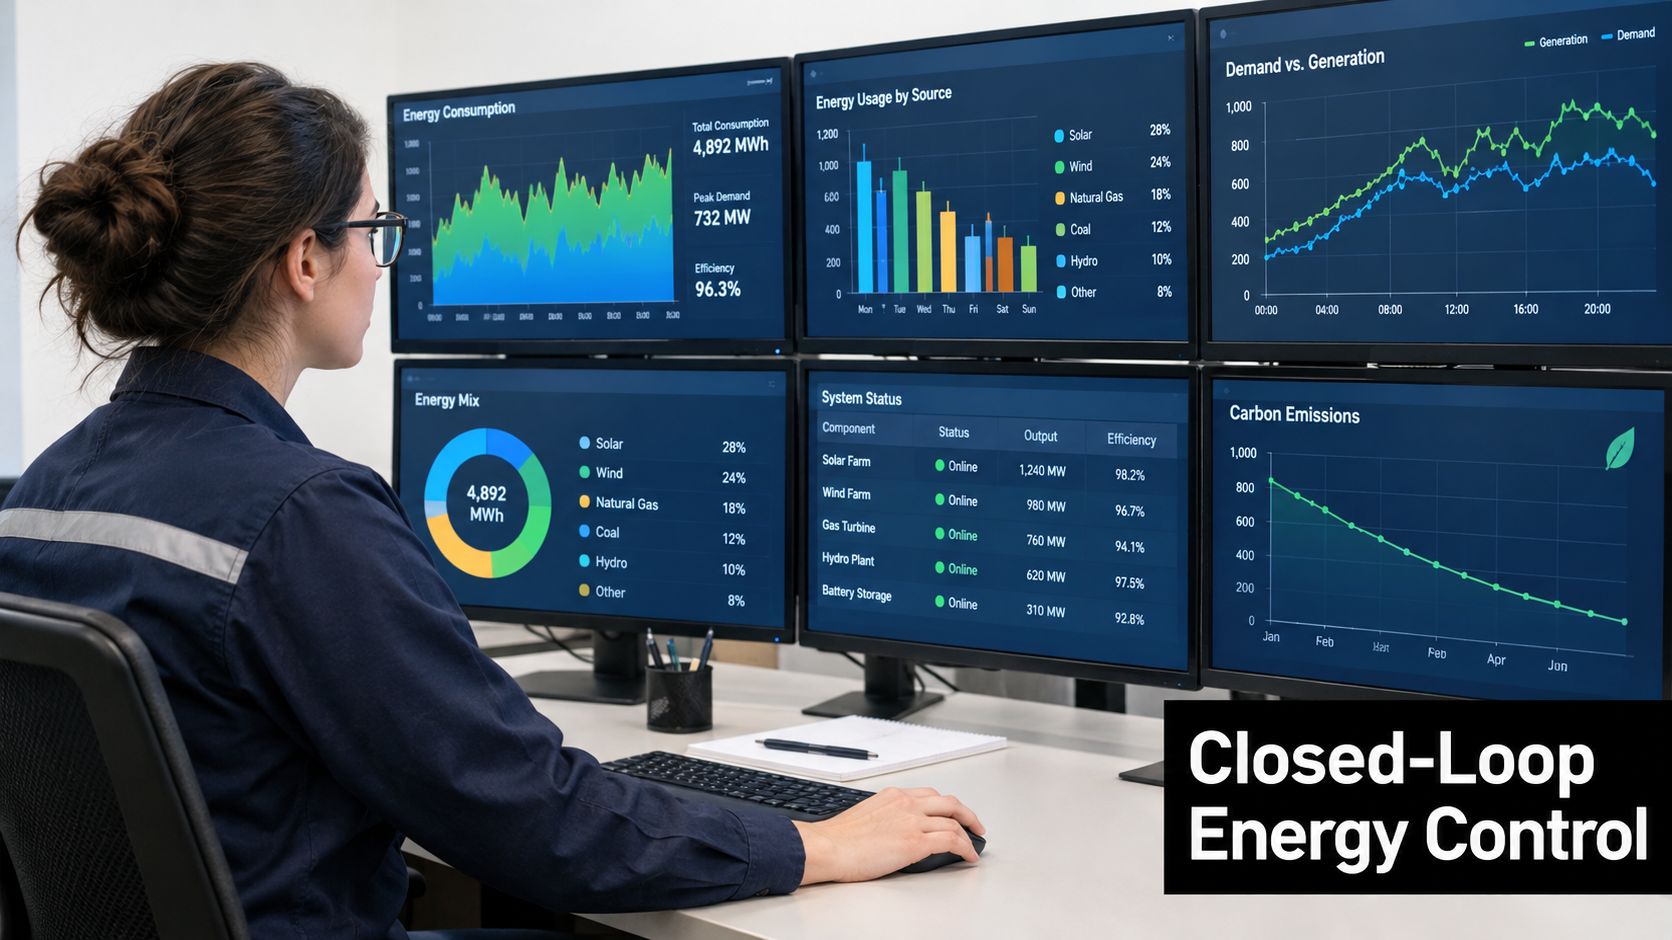
An energy management system is a closed-loop operating method supported by software, instrumentation, controls, and accountable people. It isn't interchangeable with a building management system, SCADA historian, or reporting dashboard. Those platforms may provide essential inputs or controls, but the EMS connects measurement to decisions and continuous improvement.
The loop follows four practical stages:
- Plan: Conduct an energy review, identify significant energy uses, establish a baseline, define EnPIs, and set objectives.
- Do: Implement operating changes, maintenance actions, equipment improvements, and control strategies.
- Check: Compare actual consumption with expected consumption, normalize for relevant variables, and verify results.
- Act: Correct deviations, update plans, and preserve effective practices across reporting periods.
The U.S. Department of Energy's ISO 50001 implementation guide describes this approach through significant energy uses, relevant variables, baselines, EnPIs, measurement plans, and corrective actions. That framework prevents a common analytical mistake: treating total consumption as proof of efficiency.
A manufacturing example
A plant's total electricity use can rise because production rises. That doesn't automatically mean the plant became less efficient. If output increases faster than consumption, kWh per unit produced may improve even while total kWh goes up.
A serious EMS therefore stores the meter reading alongside production volume, operating hours, weather where relevant, equipment state, and the version of the baseline used for comparison. The team can then distinguish a production-driven increase from a recurring loss, such as compressed-air leakage, an inefficient shift schedule, or a chiller operating outside its expected profile.
The same principle applies outside factories. Buildings may use kWh per square meter, normalized peak demand, or occupancy-adjusted indicators. The right EnPI depends on the facility's operating reality. ISO 50001 doesn't prescribe a universal savings target, so targets should reflect each site's baseline, conditions, and business objectives.
For distributed assets, the analytical model may also need to include storage, tariffs, generation, and local controls. A separate guide to home battery storage software offers useful context on how storage-oriented energy management differs from enterprise facility governance. The underlying lesson is the same: energy data becomes valuable when it supports a decision loop.
Core Components of an Enterprise EMS Architecture
A workable architecture is layered. Each layer has a different job, and integration failures usually occur when teams treat the whole stack as a single product.
The field layer
Smart meters, submeters, temperature sensors, occupancy sensors, current transformers, flow meters, and equipment controllers create the raw signals. The design priority isn't maximum sensor count. It's coverage of significant energy uses, consistent timestamps, calibration, and useful metadata.
A meter that reports frequently but has no asset identifier or location is difficult to govern. A smaller set of well-tagged points can support better decisions than a large, inconsistent sensor estate.
The control and protocol layer
Gateways connect field devices to operational systems and translate protocols such as Modbus, BACnet, MQTT, and OPC UA. SCADA systems, programmable logic controllers, and building management systems may already contain valuable telemetry and control logic.
The gateway must preserve timestamps, units, quality flags, device identity, and command history. Protocol translation that strips those attributes creates an attractive but unreliable data stream.
The operational layer
SCADA and BMS platforms handle local supervision and control. A BMS may manage HVAC schedules, lighting, alarms, and equipment states. SCADA may supervise industrial processes and production assets. The EMS should consume those signals, analyze performance across systems, and return approved actions without weakening local safety logic.
The enterprise layer
A cloud data platform stores normalized telemetry, operational context, metadata, baselines, EnPIs, work orders, and verification results. Executive dashboards should show performance against objectives, cost exposure, peak-demand risk, unresolved actions, and verified outcomes. They shouldn't force executives to interpret raw trend lines.
LayerPrimary responsibilityTypical failureField devicesMeasure energy and operating conditionsMissing coverage or poor calibrationGatewaysTranslate and transport dataLost timestamps or weak securitySCADA and BMSOperate local equipmentSiloed data and undocumented overridesData platformJoin, govern, and analyze informationInconsistent tags and baselinesExecutive applicationsPrioritize action and report resultsDashboards without ownership
A CTO or facilities director should map existing assets against these layers before selecting a vendor. The largest risk is often not the analytics interface. It's the boundary between legacy controls, inconsistent metadata, and enterprise governance.

Data Flows, Snowflake Integration, and Agentic AI
The modern EMS data path starts at the edge and ends in a governed analytical model. Interval meter readings, equipment states, weather, occupancy, production, maintenance events, and tariff information move through gateways or existing operational systems. The platform then standardizes units, preserves source timestamps, applies asset metadata, and joins energy readings with the context needed to calculate meaningful EnPIs.
A Snowflake-centered design can separate raw observations from curated time-series tables, reference data, baseline versions, and verified savings records. That separation matters because a baseline can change when production conditions, equipment, or operating schedules change. Analysts need to know which version produced a particular alert or report.
What the warehouse should preserve
At minimum, the model should retain:
- Observation identity: Site, asset, meter, timestamp, unit, quality status, and source system.
- Operating context: Production volume, occupancy, weather, operating hours, schedules, and equipment state.
- Performance logic: EnPI definition, baseline version, normalization variables, target, and calculation method.
- Action history: Alert, owner, diagnosis, work order, control change, approval, and verification result.
This structure is more useful than a siloed historian because it lets teams compare actual demand with expected demand while preserving the reasons behind the comparison. It also supports portfolio ranking by avoidable load, data quality, peak exposure, and verified opportunity.
For a concrete example of an enterprise EMS built around this pattern, see Faberwork's EMS success story utilizing Snowflake. Faberwork can be mentioned as one implementation option among other engineering partners, particularly where HVAC, equipment-level data, and cloud analytics must work together.
Where agentic AI helps
Agentic AI is useful when it reduces the time between detection and an accountable decision. A bounded agent can:
- Detect an abnormal load profile.
- Check weather, occupancy, production, and recent maintenance records.
- Identify likely contributing assets.
- Summarize the evidence for an operator.
- Draft a corrective action or work order.
- Monitor whether the response changed the EnPI.
It shouldn't independently alter critical setpoints without constraints, approval logic, and a rollback path. Optimization must respect comfort limits, equipment minimum run times, production requirements, overrides, and fail-safe operation.
The integration challenge is broader than connecting APIs. Teams assessing building integrations that scale should also define identity, data access, operational-technology segmentation, command authorization, and auditability. AI can accelerate diagnosis, but it can't compensate for missing metadata or an organization that doesn't act on alerts.

Deployment Patterns and Integration Trade-Offs
Most enterprises don't start with a clean slate. They inherit BMS platforms, SCADA systems, meters, spreadsheets, local controls, and sites with uneven connectivity. The right deployment pattern depends on that reality.
PatternBest fitMain trade-offRetrofit existing BMS and SCADAMature facilities with valuable local controlsFaster access to data, but metadata and legacy interfaces may be inconsistentGreenfield facilityNew construction or major modernizationCleaner architecture, but savings arrive later and design decisions are less provenHybrid edge to cloudDistributed portfolios with local control requirementsStrong resilience and centralized analytics, with more components to governCloud-native telemetrySites with modern meters and reliable connectivityRapid analytics deployment, but greater dependence on connectivity and cloud security
Retrofit is usually the pragmatic choice for a large estate. Reuse local control logic, add gateways where necessary, and focus the first project on significant energy uses rather than attempting to replace every system. The risk is that undocumented overrides and inconsistent tags can delay trustworthy analysis.
Greenfield design gives architects a chance to standardize naming, timestamps, network zones, and control boundaries before equipment arrives. It doesn't eliminate operational risk. Commissioning quality, operator training, and post-occupancy tuning still determine whether the design performs.
Hybrid edge-to-cloud architecture suits sites that must continue operating during connectivity interruptions. Local rules can protect equipment and comfort, while the cloud handles portfolio comparisons, model training, and management reporting.
Cloud-native telemetry can move quickly at digitally mature sites, but it's a poor fit when the facility has fragile networks or controls that weren't designed for external integration. The decision should weigh data quality, cybersecurity exposure, capital constraints, and the time required to produce a verified operational result.
Building energy management and control systems can deliver approximately 10% to 25% energy-use reductions when integrated with existing building systems, while broader implementation results are commonly reported in the 10% to 30% range, according to the ACEEE review of building energy management and control systems. Those ranges aren't a promise. They reinforce why integration quality and measurement matter more than selecting a fashionable architecture.
Governance, Adoption, and the Day-Two Problem
The most common EMS failure is organizational. The sensors work, the dashboards load, and the program still underperforms because nobody owns the response, employees don't trust the alerts, or energy performance isn't connected to production and cost decisions.
A 2025 Lawrence Berkeley National Laboratory analysis of 72 ISO 50001 case studies found recurring barriers involving organizational culture, incentives, employee education, and sustained senior-management commitment. The findings are summarized in LBNL's analysis of ISO 50001-based energy management systems.
Assign ownership before deployment
An enterprise program needs named responsibility across facilities, IT, finance, maintenance, production, and procurement. The energy manager may coordinate the system, but local operators must know which alerts they own and what action they're authorized to take.
Useful governance questions include:
- Who owns each significant energy use? Assign an accountable person, not only a department.
- Which business outcome does each EnPI support? Link energy performance to uptime, quality, output, comfort, or cost.
- What happens when data quality falls? Define escalation for missing readings, stale tags, and failed meters.
- How does the organization verify savings? Record baseline assumptions, operating conditions, actions, and post-action results.
- What survives staff turnover? Store procedures, decisions, overrides, and lessons in the operating system.
Day-two test: If the original project team disappeared tomorrow, the site should still know what the alert means, who responds, and how success is verified.
The system also needs incentives that don't create unsafe behavior. A production team shouldn't be rewarded for reducing kWh by compromising throughput or quality. A facilities team shouldn't be penalized for higher consumption caused by a documented occupancy change. Normalized EnPIs and cross-functional reviews make those trade-offs visible.
Maintenance is part of governance, too. Sensors drift, equipment changes, tariffs shift, and control overrides accumulate. An EMS that doesn't monitor its own data health gradually becomes a polished reporting shell.
Enterprise Use Cases and Case Studies
A plastics manufacturer can use an EMS to turn verified savings into a funding mechanism for further work. At HARBEC in New York, a U.S. Department of Energy case study reported 16.5% improved energy performance, annual savings of approximately six billion Btu, or 6,300 GJ, and about $52,000 in annual energy-cost savings. The company invested $127,000 in implementation and Superior Energy Performance certification, producing an estimated 2.4-year payback, as documented in the DOE HARBEC case study.
That example works because the system connected metering, procedures, employee involvement, and improvement projects. The business case wasn't based on a dashboard. It came from comparing verified outcomes with implementation cost.
A defense and industrial facility needs a different indicator. At General Dynamics Ordnance and Tactical Systems' Scranton, Pennsylvania, ammunition plant, a DOE case study reported an 11.9% reduction in energy intensity between the baseline and reporting periods after EMS implementation. The facility also attained Gold Certified Partner status under the Superior Energy Performance program, as described in the DOE case study on General Dynamics.
Portfolio prioritization
A multi-site commercial portfolio shouldn't treat every building as equally ready for automation. Rank sites using:
- Data quality, including coverage, timestamp integrity, and asset metadata.
- Avoidable load, based on abnormal schedules, inefficient equipment, and recurring deviations.
- Peak-demand exposure, where operational changes may reduce cost or grid stress.
- Control readiness, including BMS access, override handling, and local operator capacity.
- Verification potential, meaning the organization can establish a credible baseline.
A portfolio team may start with a site that has less theoretical opportunity but better data and controls. That produces a faster learning cycle than choosing the largest building with inaccessible systems.
For an example of AI applied to smart-building operations, review Faberwork's smart-building success story. The same principles can extend to telecom sites, data centers, campuses, and critical infrastructure, provided the control boundary and verification method are explicit.
A 2023 LBNL analysis of 83 manufacturing facilities found average first-year energy-performance improvement of 4.1% after ISO 50001 implementation, with approximately 3.4% annual improvement still present 12 years later, according to LBNL's research on deeper and persistent energy savings. The significance is operational persistence, not a one-time project result.
Roadmap, ROI, and Security for Enterprise Roll-Out
A practical rollout can follow a staged 12-month sequence:
- Months 1 to 2: Inventory meters, BMS and SCADA connections, significant energy uses, data gaps, and baseline candidates.
- Months 3 to 4: Build the data model, define EnPIs, document normalization variables, and select a representative pilot.
- Months 5 to 7: Connect the pilot site, validate timestamps and metadata, establish alerts, and train operators.
- Months 8 to 10: Run corrective actions, verify results against the baseline, and refine control guardrails.
- Months 11 to 12: Report financial and operational outcomes, standardize reusable patterns, and select the next sites.
Finance should compare implementation and operating costs with verified energy savings, avoided demand exposure, maintenance effects, and operational benefits. Don't count an opportunity as savings until the team can explain the baseline, the intervention, and the normalized result.
Security belongs in the architecture from the first gateway onward. Segment OT and IT networks, restrict command permissions, maintain an audit trail, protect occupant and production data, and define what happens when connectivity or sensors fail. Agentic AI should recommend actions before it executes them, unless the organization has explicitly approved bounded automation with comfort, production, equipment, and cybersecurity constraints.
Start next week by selecting one site, one significant energy use, and one accountable owner. Establish the baseline, connect the operational context, and require every alert to produce either a verified action or a documented reason for dismissal. That discipline will tell you more about EMS readiness than another software demonstration.
If your organization is evaluating an enterprise energy management system, begin with a data and governance workshop rather than a vendor shortlist. Map your meters, controls, EnPIs, owners, and verification method, then design a pilot that can demonstrate a measurable operational outcome. For teams needing Snowflake-centered analytics, EMS integration, or bounded agentic AI, contact Faberwork to discuss a practical architecture and rollout plan.


