Monday morning starts with a familiar problem. A dispatcher opens the transport management system, the fleet platform, and the customer portal, then finds three different answers to the same question: is the load on time? One system uses the planned arrival, another uses the latest scan, and the third treats a missing partner update as a delay. The team spends its first standup debating the number instead of acting on the exception.
That's the practical starting point for logistics data analytics. It turns telematics, TMS, WMS, IoT, customs, and partner events into consistent metrics that people can use for routing, maintenance, inventory, and customer service. The work is bigger than building dashboards. It creates the shared operational language that lets a logistics director decide which loads need intervention, which vehicles need attention, and which inventory positions require action.
The Monday Morning Dashboard Problem

The dispatcher's disagreement usually starts with an event definition. “On time” might mean arriving before the customer's requested window, before the carrier's appointment, or before an internal milestone. Those definitions can all be valid, but they cannot be mixed inside one performance measure.
The same problem appears with units and clocks. A warehouse records local time, a carrier sends UTC, and a partner portal rounds timestamps to the nearest minute. A route dashboard counts miles from GPS positions while a finance report uses invoiced distance. The charts look precise because the software displays clean lines and numbers. The underlying records still describe different realities.
Practical rule: Define the business event before choosing the dashboard visual.
A useful definition of logistics data analytics has three parts:
- Capture: Collect operational events from vehicles, shipments, facilities, orders, customs processes, and partners.
- Conform: Standardize names, timestamps, locations, identifiers, units, and status transitions.
- Decide: Turn the conformed records into actions for dispatchers, maintenance planners, warehouse managers, and customer teams.
That final step separates analytics from passive reporting. A descriptive view tells you which loads arrived late. A diagnostic view connects lateness to a port dwell event, a missed appointment, or a route deviation. A predictive view flags a likely delay or vehicle failure early enough for someone to respond.
Leaders often want to start with another dashboard because it produces a visible deliverable. The stronger first investment is an event dictionary. It should state what counts as pickup, departure, arrival, delivery, dwell, exception, cancellation, and on-time completion. It should also identify the source of truth, acceptable lateness, timezone rules, and what happens when a scan is missing.
The governance gap is measurable. According to a 2025 Institute for Supply Management survey on data and analytics, 86% of respondents viewed data governance as necessary for their supply chain, while only 65% reported having a dedicated data-governance function. That difference explains why teams can own capable tools without trusting the output.
For a practical reference on the measures teams use to understand variability between shipment stages, review these middle-mile delivery variability benchmarks. Use external benchmarks as context, not as a substitute for defining your own internal events.
What Data Logistics Analytics Actually Consumes
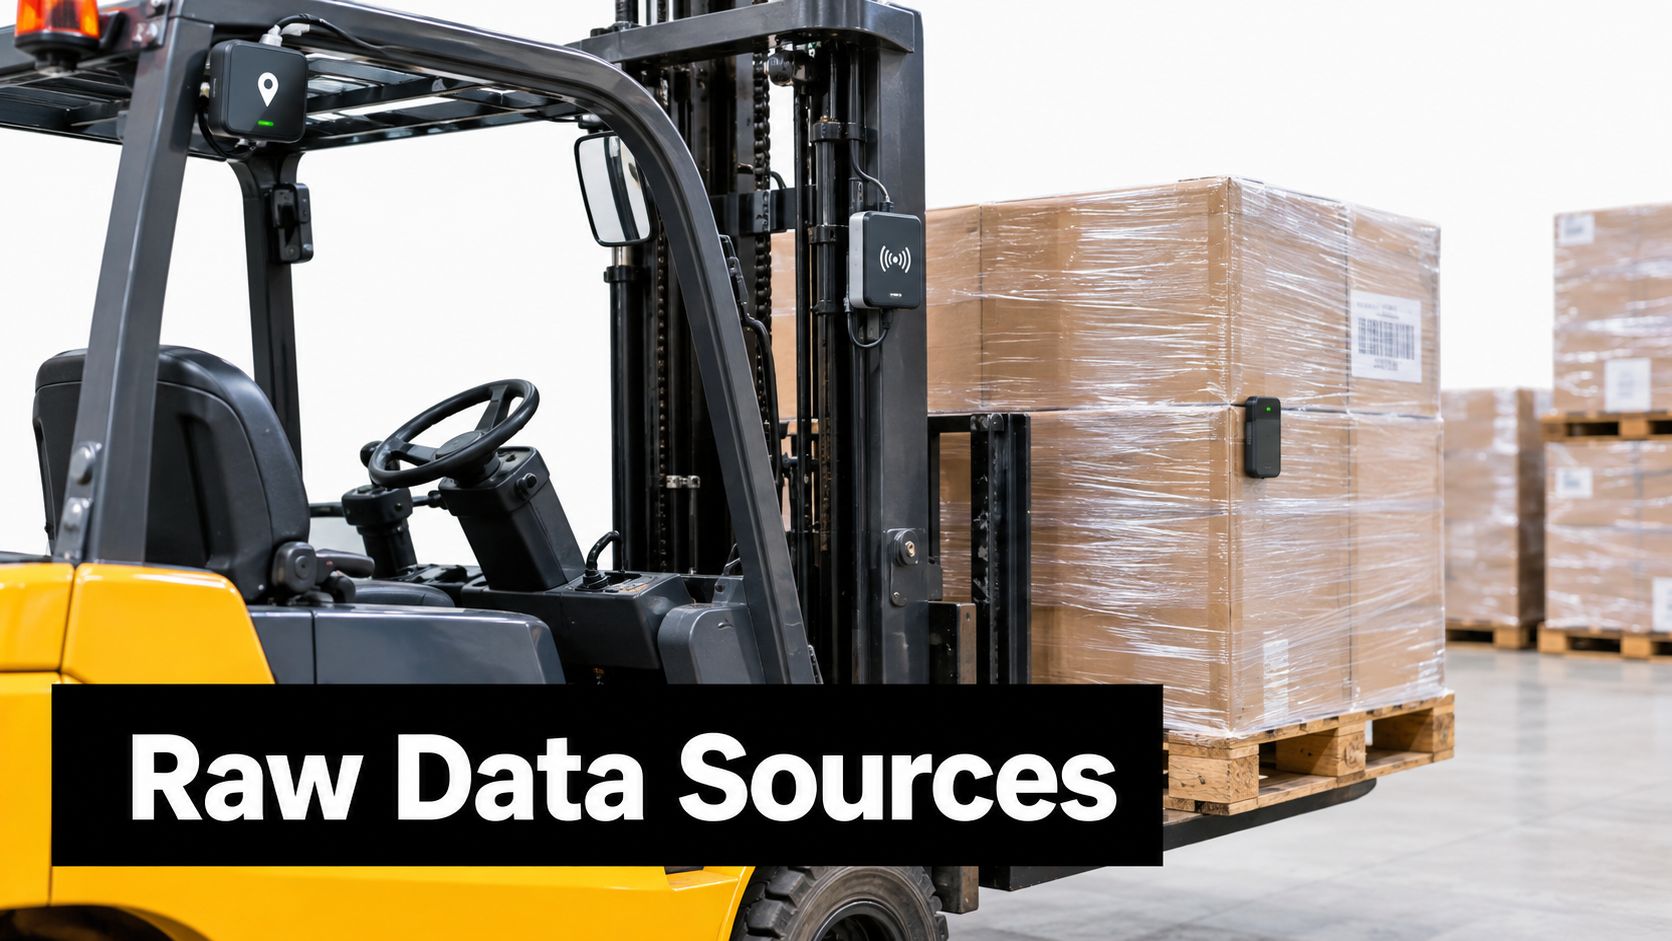
A Snowflake rollout becomes easier to reason about when you view the data like a warehouse floor. Raw events are pallets arriving at the receiving dock. They're useful, but they haven't been checked, labeled, or placed in the correct aisle.
Start with the receiving dock
The raw layer may contain GPS pings, ELD events, EDI 214 status messages, IoT temperature readings, WMS scanner events, fuel-card transactions, customs timestamps, and partner portal updates. Each source has a different delivery pattern. GPS may arrive continuously, EDI messages may arrive as discrete updates, and a partner file may arrive in batches.
At this stage, preserve the original payload and its arrival metadata. Do not overwrite a questionable timestamp or convert a status. The raw record is your evidence when an operations manager asks why a metric changed.
Build the labeled inventory
The standardization layer turns source-specific events into shared records such as trip, stop, load, route, leg, and consignment. Here, you reconcile clocks, map coordinates to facilities, connect carrier identifiers to internal entities, and distinguish an arrival scan from a planned arrival.
The warehouse analogy is a receiving clerk checking labels before shelving a pallet. If the clerk places a pallet in the wrong aisle, every downstream picker works from a false location. In the same way, a bad facility mapping can distort dwell time, route performance, and customer service reporting.
Create decision-ready marts
Curated marts organize conformed data around decisions rather than source systems. A fleet mart supports utilization, idling, fuel, and maintenance. A route mart supports planned versus actual movement. An inventory mart connects purchase orders, warehouse balances, and demand. An emissions mart records measured values separately from modeled estimates.
The need for event-level timing is clear in international logistics. The 2023 World Bank Logistics Performance Index report found that 44 days elapsed on average from a container's entry into the exporting country's port until it left the destination port, with a 10.5-day standard deviation. That port-to-port interval represented roughly 60% of total international trade lead time. A single end-to-end delivery number would hide where that time accumulated.
Before designing tables, catalogue:
- Source ownership: Who controls each feed, and who is accountable when it stops?
- Event grain: Does a row represent a ping, scan, stop, shipment, or movement?
- Identity keys: How do you connect vehicle, driver, order, load, facility, and carrier identifiers?
- Time semantics: Which timestamps are planned, observed, received, or inferred?
- Quality signals: Can you measure missingness, duplication, lateness, and partner consistency?
For finance and operations teams comparing performance measures, a guide to FedEx contractor ROI metrics can provide useful vocabulary. Your warehouse model still needs definitions suited to your contracts and operating decisions.
A Snowflake-Centered Architecture That Actually Scales
Snowflake works well as an integration spine when it gives every workload access to the same governed event layer. The choice isn't between one product and another. It's between a shared operational foundation and a collection of point tools that each creates its own version of a shipment, route, or delay.
A Snowflake-centered design commonly separates three layers:
- Raw: Immutable source payloads, ingestion metadata, and replayable history.
- Conformed: Standard entities and event definitions shared across telematics, TMS, WMS, and partner feeds.
- Curated: Business-ready marts, metrics, feature tables, and access-controlled views.
Snowpipe can support continuous file ingestion, while Snowpark can keep transformation and model-related logic close to the data. The design should also support scheduled batches and event-driven updates because logistics systems rarely operate on one rhythm.
A fragmented stack may deliver a fast route dashboard, a separate fleet score, and an isolated warehouse report. Each tool can appear effective until a director asks for one explanation of a late consignment that crosses all three systems. A shared conformed layer lets the route, maintenance, customer, and finance teams refer to the same movement history.
Snowflake also provides a practical base for time-series workloads. Faberwork's time-series data with Snowflake success story illustrates the type of architecture used when operational events must remain queryable across time rather than reduced to a current status.
Feature tables sit above the conformed layer for machine learning. A route model might use historical travel time, stops, payload, road conditions, and congestion. A maintenance model might use fault codes, mileage, service history, utilization, and inspection outcomes. Version those features with the model and the decision date, otherwise a later correction can rewrite the past and make a prediction look better than it was.
Agentic AI workflows belong at the decision layer, not inside an uncontrolled source system. An agent can inspect a governed exception record, retrieve relevant shipment history, compare available options, and recommend an escalation. A human can then approve the action or reject it with a reason that becomes part of the audit trail.
The architecture becomes safer when the agent can see confidence, provenance, and policy constraints alongside the recommendation. It shouldn't infer that a missing scan means a missed delivery, or reroute a load without checking appointment windows and contractual rules.
The operational test is simple. Ask whether a dispatcher, data scientist, and finance analyst can trace their numbers back to the same event history. If they can't, adding an agent will increase the speed of disagreement rather than the quality of decisions.
Use Cases That Pay the Bills in Fleet, Routes, and Warehouses
The strongest logistics analytics programs begin with a costly decision, not an attractive visualization. Empty miles, late arrivals, vehicle downtime, and stockouts each require different data and different owners.
Use CasePrimary DataHeadline KPITypical WinFleet optimizationGPS, utilization, fuel, payload, vehicle typeLoaded kilometers and fuel per tripFewer empty movements and better asset useRoute planningStops, capacities, time windows, traffic, constraintsPlanned versus actual distance and arrivalMore efficient routes with fewer service failuresPredictive maintenanceFault codes, repairs, mileage, inspections, utilizationCalibrated failure risk and downtimeEarlier intervention before roadside failureInventory and warehouseOrders, balances, scans, receipts, supplier updatesStock position and replenishment reliabilityBetter coordination and fewer avoidable shortagesDemand forecastingHistorical shipments, lanes, regions, timing, capacityForecast quality and capacity alignmentCapacity assigned before loads are created
Fleet and route decisions
Route optimization changes more than mileage. It affects fuel, driver time, delivery reliability, fleet capacity, and customer promises. The World Business Council for Sustainable Development's Road Freight Lab report estimates that route and asset optimization can reduce road-freight transportation costs by an average of 12.5%, while approximately 85% of the road-freight sector still operated routes that were not optimized.
A model should compare an optimized plan with the baseline plan, then measure actual performance. Without that counterfactual, a team can mistake a favorable week for an improvement caused by the algorithm.
Maintenance before failure
Predictive maintenance doesn't require every vehicle to become an IoT project. A comparative study found that random forest achieved a mean 5-fold cross-validation AUC-ROC of 0.8546, XGBoost achieved 0.8528, and logistic regression achieved 0.8215 in maintenance-need prediction using transport-management records, as reported in the Journal of Transportation Technologies study.
Those figures describe model discrimination, not business value. Set thresholds using the cost of a missed breakdown and the cost of sending a healthy vehicle to the workshop. Track calibration, false negatives, false positives, downtime avoided, and maintenance cost per vehicle.
Inventory visibility and demand
Inventory analytics works best when supplier, warehouse, and retailer data connect. Simulation evidence from Cachon and Fisher reported in the Journal of Business Logistics synthesis showed supply-chain costs were 2.2% lower when a supplier could see the retailer's inventory status rather than only the retailer's orders.
Demand forecasting links the other use cases. A week-ahead view can help allocate capacity before dispatch, while inventory signals can reveal whether a shipment is urgent because of a real stock position or because an order was placed. For leaders assessing AI sequencing, this guide on where to begin with agentic AI in transport logistics is useful context. Start with recommendations and controlled approvals before granting autonomous execution.
Geofences also deserve a place in the operating model. A fleet management geofencing example shows how location events can support arrival detection, route monitoring, and exception workflows when the underlying facility boundaries and event rules are governed.
A Four-Phase Roadmap From Spreadsheets to Agentic AI
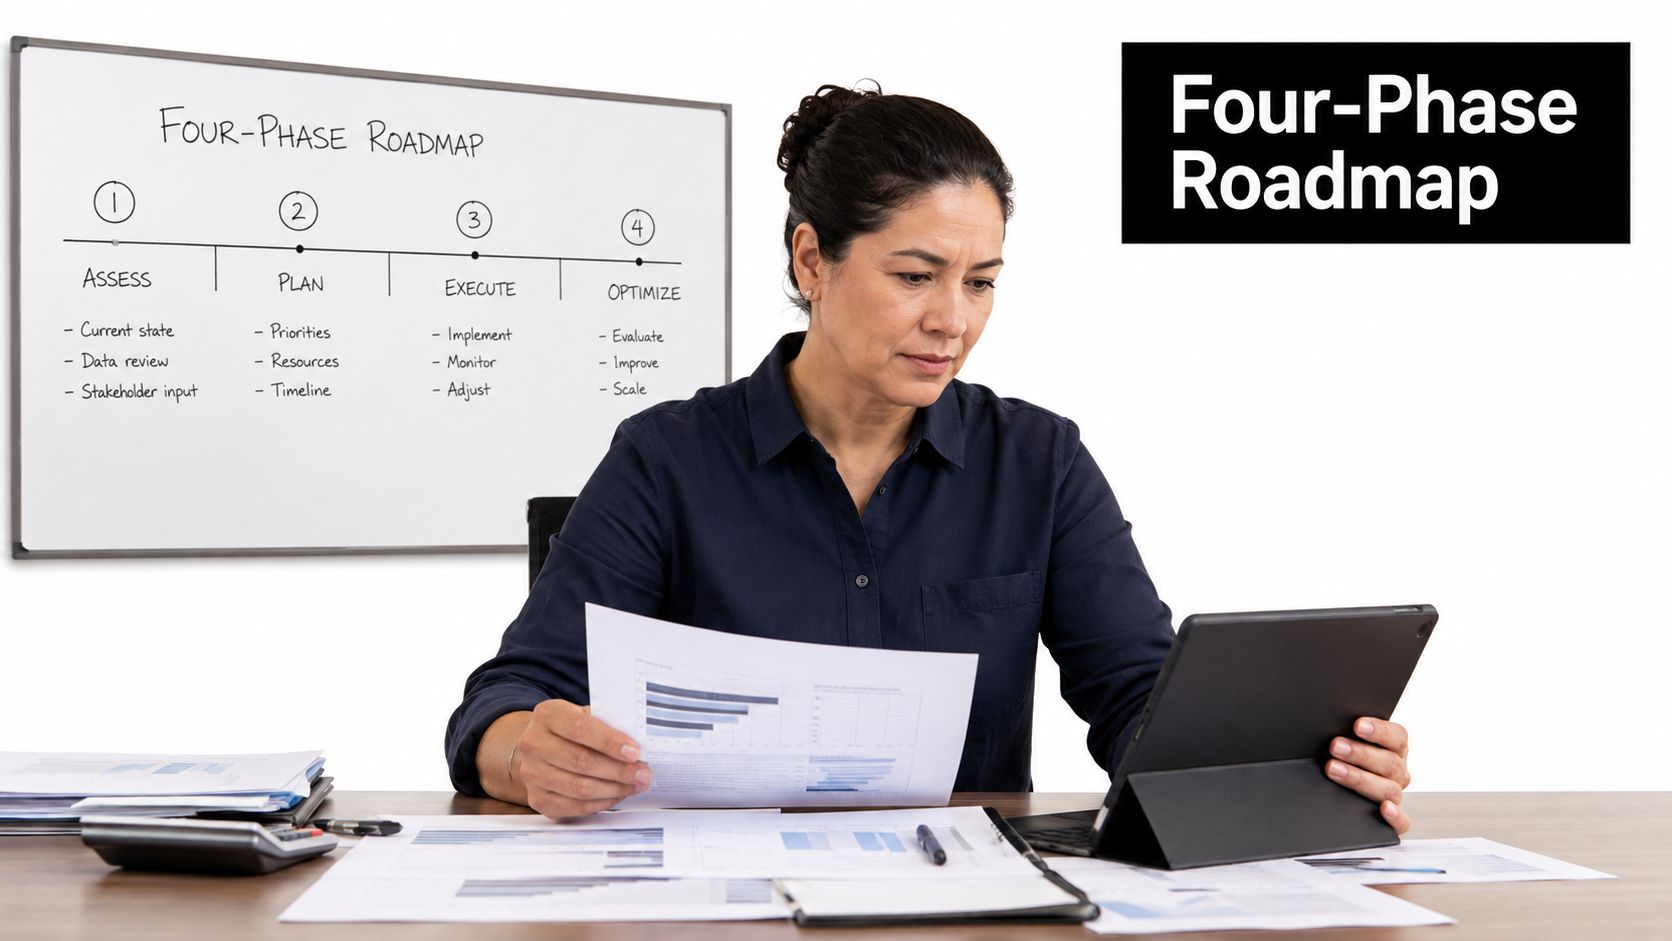
A rollout should follow operational dependency, not software fashion. Each phase needs an entry condition, a useful deliverable, and a test that proves the next phase is safe.
Phase one, instrument
Start with one decision, such as missed delivery appointments or vehicle downtime. Inventory the source systems, identify the event owners, and write definitions for planned, observed, completed, and exception states.
The exit condition is a replayable event set that operations can reconcile against known shipments. Add automated tests for duplicate identifiers, impossible timestamps, missing facility mappings, and unexpected status transitions. If the team can't explain a record, don't feed it into a decision model.
Phase two, integrate
Connect TMS, WMS, telematics, and partner feeds into the Snowflake-centered event layer. Keep raw payloads intact, then publish conformed entities and curated marts for the selected use case.
The exit condition is a shared metric that the dispatcher, warehouse manager, and finance analyst can query without manual spreadsheet joins. Test freshness, row counts, referential integrity, and source-to-curated reconciliation continuously.
Phase three, automate
Introduce routed alerts, optimization models, and controlled Agentic AI workflows. A model can flag likely late arrivals, recommend a route change, or prioritize an inspection. An agent can summarize evidence and prepare the next action, but the workflow should escalate low-confidence cases to a person.
The exit condition is measured operational movement in the selected KPI. For route work, compare planned and actual distance, arrival reliability, and fuel. For maintenance, compare risk predictions with completed work orders and downtime.
Phase four, govern
Make lineage, ownership, partner-level quality scoring, and review thresholds part of normal operations. A partner score can reflect missing scans, late messages, duplicate events, and inconsistent identifiers. It shouldn't punish a partner for a rule that was never communicated.
The exit condition is an auditable system where every important metric has an owner, every model has a version, and every automated action has a policy. The Road Freight Lab estimate that route and asset optimization can reduce costs by an average of 12.5%, with approximately 85% of routes still not optimized, gives leaders a reason to prioritize the work, but the business must validate the opportunity against its own baseline and constraints.
Governance and Trust Decide Whether Analytics Gets Used
A dashboard cannot rescue an undefined event. If one carrier marks “delivered” at the customer gate while another waits until unloading, the model learns a process difference between carriers and may label it operational performance. The number can look precise while measuring different moments.
The same trap appears in automated dispatch. One manufacturer may connect an agent to an unreliable event stream and ask it to reroute every exception. Another first defines the events, scores partner-level data quality, and sends low-confidence cases to a person for review. The second approach may appear slower because it exposes uncertainty early. That visibility gives the workflow a better chance of staying useful when operating conditions change.
The controls that matter
A governed Snowflake event layer should make these controls visible across telematics, TMS, WMS, partner feeds, and Agentic AI workflows:
- Data contracts: Specify fields, formats, event timing, ownership, and failure handling for each important partner feed.
- Definition ownership: Assign a named business owner to terms such as on time, delivered, dwell, available, and failed.
- Lineage: Let users trace a dashboard number from the conformed event back to the original source payload.
- Partner quality: Report missing, late, duplicated, and contradictory events by partner, rather than hiding them in one global score.
- Human review: Route low-confidence predictions and policy exceptions to people who can approve, reject, or correct them.
- Model monitoring: Track calibration, drift, false positives, false negatives, and operational outcomes, not only a training score.
A dashboard earns trust when a manager can challenge a number and receive an evidence trail, not a new explanation.
Governance also covers emissions. Transportation produces 16% to 25% of global greenhouse-gas emissions, while freight logistics contributes roughly 7% to 8%, according to the World Economic Forum emissions discussion. The same source estimates that better day-to-day operations could reduce freight-logistics emissions by 4% to 7% from the current baseline.
Those estimates do not solve the measurement problem. Shared loads, empty miles, transshipment, missing fuel data, and carrier calculations all require explicit allocation rules. Store measured emissions separately from modeled estimates. For each route recommendation, show the trade-offs among service, cost, resilience, and emissions.
The maturity test is practical. Can the team define the event, name its owner, measure its quality, trace its lineage, and state when a human must intervene? If so, the algorithm has a trustworthy place to operate.
Your First Two Weeks on This Problem
Use the next two weeks to narrow the program to decisions people already make.
Days one through three, choose the operational question. Pick late-arrival intervention, empty-mile reduction, maintenance prioritization, or inventory replenishment. Name the decision owner and write the event definition before anyone requests a dashboard.
Days four through six, map the evidence. List the TMS, WMS, telematics, partner, and finance records involved. Record the identifier used to connect each source, the timestamp type, the timezone, and the expected update pattern.
Days seven through nine, ship two views. The first should show operational exceptions that need action today. The second should show the baseline KPI and its contributing events, so managers can investigate rather than accept a score blindly.
Days ten through twelve, run one predictive pilot. Maintenance risk is a practical candidate because transport-management records can support useful predictions before richer sensor coverage exists. Keep the pilot in recommendation mode, version the feature snapshot, and record every human decision.
Days thirteen and fourteen, put governance on the leadership agenda. Ask who owns “on time,” how missing scans are handled, which partners have unreliable events, what confidence level requires review, and who approves an automated action.
The architecture can scale from a governed Snowflake event layer to optimization services and Agentic AI workflows. The governance work determines whether that scale remains dependable. Start with one decision, make its evidence traceable, and expand only after operations can show that the KPI moved for the intended reason.
Bring your TMS, WMS, telematics, and partner-feed problem to a data architecture workshop, define the first event contract, and identify the Snowflake tables needed for a trusted pilot. Then select one measurable workflow, such as late-load triage or maintenance prioritization, and give your operations team a governed recommendation they can test within the next planning cycle.


